When we set out to benchmark cloud storage competitors against the incumbent (AWS), we expected to find some performance differences—but we didn’t anticipate just how dramatically location could make or break your storage strategy. What started as a straightforward comparison of AWS S3, Backblaze B2, Wasabi Hot Storage, and Storj Object Storage quickly revealed a sobering reality: the wrong storage decision can cripple your global operations before you even realize what’s happening. Picture this—your Sydney team trying to access files stored in your EU bucket experiences a staggering 95% performance drop compared to local access, turning what should be routine file operations into productivity nightmares. Over the course of comprehensive testing across four global regions with varying file sizes and time periods, we uncovered performance patterns that could save—or cost—your organization significant time, money, and sanity. Whether you’re planning a global expansion, optimizing existing operations, or simply trying to avoid the architectural quicksand that comes with poor storage choices, this data-driven analysis reveals the hidden speed traps lurking in your cloud storage decisions.
Objective
This test aims to benchmark the performance of Storj Object Storage, AWS S3, Backblaze B2, and Wasabi Hot Storage. The primary goal is to quantify the performance differences among these services across various regions and parameters, including node location, bucket location, file size, and time of day. Additionally, the test seeks to determine how cloud storage performance can be expected to vary based on its location and access point for a production environment with globally distributed resources.
Test Setup
Initial/Comprehensive Test Suite
- Compute:
-
- HostHatch was used to create compute nodes in Los Angeles, London, New York, and Sydney.
- Each node was configured to run an hourly cron job to test the performance of every S3 Compliant bucket, for each provider, in each region, with various file sizes.
-
- S3 Compliant Storage:
-
-
- Wasabi:
- ap-southeast-2
- eu-west-1
- us-east-1
- us-west-1
- AWS: AWS S3 Buckets were created in each of the following regions with the standard storage class. Glacier Instant access was also considered, but not used.
- ap-southeast-2
- eu-west-2
- us-east-1
- us-west-1
- Backblaze: Backblaze B2 Buckets were created in each of the following regions. B2 Overdrive was also considered, but access to B2 Overdrive requires a multi-petabyte commitment.
- EU Central
- US East
- US West
- Storj:
- Global
- US Select
- Wasabi:
-
- Benchmark Software:
-
- Warp S3 Benchmarking Tool was was used to run tests. YAML files were configured for each S3 provider and bucket region combination for GET and PUT tests with variables for concurrency of requests, file size, and length of test.
Time of Day Testing
A second test was run with a similar set up. HostHatch nodes were set up in the same cities. S3 Buckets were also set up in the same regions, and Warp was used on an hourly basis via a cron job from each node to test the performance of the S3 compliant services. The key difference was that each compute node only accessed its same-region bucket for each competitor and only using a small file size/concurrency to stick to a maintainable bandwidth over the course of a full week.
Test Procedure
Initial/Comprehensive Test Suite
Every hour on the hour a script was run that would use Warp to benchmark the performance of every bucket from every compute node. For each bucket:
- First the script would clear the bucket and run a PUT test for 200MB files of random data. (Concurrency 10, 30s)
- Then it would run a GET test with those files from the previous PUT test. (Concurrency 10, 30s)
- Next it would clear the bucket and run a PUT test for 1GB files of random data. (Concurrency 10, 1m)
- Then another GET test with those same 1GB files. (Concurrency 10, 1m)
- Finally, the bucket would be cleared once more so that a PUT test could be run with 5GB files. (Concurrency 4, 2m)
- That would be followed by another GET test for those same 5GB files. (Concurrency 10, 2m)
- Once all of those tests were complete, the script would continue on to the next bucket, running all the same tests, until the suite had been run for every bucket from every provider.
- NOTE: The suite of tests often took longer than an hour to run, so whenever UTC Hour is referenced, that is the hour at which the test suite began, and does not necessarily reflect the time at which a specific bucket was benchmarked.
Time of Day Testing
Every hour on the hour a script was run that would use Warp to benchmark the performance of each competitor within each region. For each competitor, the nearest bucket was accessed/tested from each region thus:
- First the script would clear the bucket and run a PUT test for 10MB files of random data. (Concurrency 8, 10s)
- Then it would run a GET test with those files from the previous PUT test. (Concurrency 8, 10s)
- A script would then run to delete the files in that bucket.
- Once those tests were complete, the script would continue on to the next bucket, running the same tests, until the suite had been run for each provider in the region.
- NOTE: For these tests, the hourly cron job was significantly lighter, and did complete close to the beginning of the hour.
Results
Every individual test had its full results saved in a .json.zst file. Warp was used to analyze the results of each test, and a script pulled the Average Throughput and Time to First Byte (TTFB) from all of the GET tests. It also pulled the Average Throughput from the PUT tests. Occasionally the tests on a particular bucket would encounter errors (not so for the Time of Day Testing). Some reasons why this might occur included, the files from the bucket being cleared by a test that was running concurrently from a different node (this happened infrequently) or the bucket hitting a downloading bandwidth cap (this happened for Backblaze US East). For any tests where the number of errors was greater than half the number of total requests, the results were dismissed as invalid.
The full results can be found at in this spreadsheet:
https://docs.google.com/spreadsheets/d/1bs-ox4of8Wh8bdVjGfSEThi8-8Rb0B2CFg5MPLDHJ1E/
Here are some aggregated summaries of the results split by Size of File:
200MB
| Node Location | Values | ||||||||||||
| London | Los Angeles | New York | Sydney | ||||||||||
| S3 Provider | Bucket Region | GET Throughput MiB/s | GET TTFB ms | PUT Throughput MiB/s | GET Throughput MiB/s | GET TTFB ms | PUT Throughput MiB/s | GET Throughput MiB/s | GET TTFB ms | PUT Throughput MiB/s | GET Throughput MiB/s | GET TTFB ms | PUT Throughput MiB/s |
| aws | ap | 21.4 | 570.5 | 206.4 | 124.5 | 277.5 | 164.4 | 28.2 | 430.9 | 286.4 | 746.3 | 49.8 | 903.0 |
| eu | 865.0 | 64.0 | 898.2 | 150.7 | 243.5 | 227.9 | 190.8 | 158.5 | 476.9 | 25.3 | 513.6 | 232.0 | |
| us_east | 53.9 | 209.7 | 485.9 | 267.5 | 123.3 | 325.2 | 579.2 | 85.0 | 672.2 | 26.3 | 411.7 | 290.0 | |
| us_west | 36.4 | 282.7 | 342.4 | 469.9 | 52.3 | 344.0 | 97.8 | 180.7 | 362.6 | 29.9 | 297.5 | 362.5 | |
| backblaze | eu | 783.9 | 61.3 | 601.2 | 129.2 | 359.5 | 295.7 | 342.9 | 152.3 | 295.4 | 62.3 | 569.5 | 193.5 |
| us_east | 326.1 | 140.0 | 578.6 | 318.5 | 109.0 | 486.0 | 696.2 | 91.2 | 444.6 | 86.9 | 409.0 | 274.1 | |
| us_west | 108.0 | 355.9 | 306.2 | 308.0 | 126.9 | 300.9 | 332.6 | 149.3 | 427.9 | 111.8 | 344.6 | 325.8 | |
| storj | global | 357.0 | 215.8 | 690.7 | 99.4 | 469.0 | 316.9 | 187.3 | 289.1 | 653.8 | 49.3 | 881.0 | 173.6 |
| us_select | 152.1 | 317.1 | 626.8 | 159.8 | 227.4 | 443.6 | 776.3 | 61.7 | 689.1 | 44.7 | 653.2 | 268.2 | |
| wasabi | ap | 62.8 | 844.2 | 51.7 | 125.7 | 502.7 | 158.1 | 95.4 | 647.6 | 80.2 | 653.6 | 44.4 | 703.9 |
| eu | 539.2 | 64.3 | 748.3 | 164.7 | 342.1 | 356.6 | 393.8 | 162.9 | 506.2 | 33.3 | 905.8 | 245.7 | |
| us_east | 211.3 | 204.0 | 539.2 | 218.3 | 197.8 | 452.4 | 437.1 | 84.1 | 721.6 | 44.7 | 846.5 | 254.7 | |
| us_west | 155.3 | 432.8 | 202.2 | 252.6 | 162.8 | 313.6 | 299.7 | 205.3 | 257.9 | 44.8 | 746.3 | 186.3 |
1GB
| Node Location | Values | ||||||||||||
| London | Los Angeles | New York | Sydney | ||||||||||
| S3 Provider | Bucket Region | GET Throughput MiB/s | GET TTFB ms | PUT Throughput MiB/s | GET Throughput MiB/s | GET TTFB ms | PUT Throughput MiB/s | GET Throughput MiB/s | GET TTFB ms | PUT Throughput MiB/s | GET Throughput MiB/s | GET TTFB ms | PUT Throughput MiB/s |
| aws | ap | 25.8 | 575.9 | 278.6 | 100.0 | 314.3 | 186.7 | 50.3 | 445.5 | 353.5 | 661.8 | 61.2 | 919.5 |
| eu | 752.8 | 71.0 | 915.9 | 128.5 | 306.5 | 236.1 | 129.5 | 222.3 | 531.0 | 29.1 | 536.5 | 268.1 | |
| us_east | 84.6 | 227.7 | 540.8 | 241.2 | 189.2 | 329.9 | 314.9 | 117.6 | 581.3 | 36.3 | 444.1 | 337.1 | |
| us_west | 65.5 | 303.6 | 418.9 | 417.5 | 80.8 | 359.6 | 104.2 | 192.2 | 346.5 | 40.5 | 371.8 | 479.4 | |
| backblaze | eu | 503.5 | 239.6 | 327.8 | 110.6 | 413.0 | 309.6 | 214.5 | 253.8 | 273.3 | 84.6 | 774.6 | 211.4 |
| us_east | 234.7 | 214.0 | 531.0 | 208.7 | 224.3 | 359.0 | 869.5 | 295.8 | 424.3 | 112.4 | 570.5 | 366.6 | |
| us_west | 135.3 | 351.5 | 382.2 | 408.5 | 123.5 | 316.7 | 266.8 | 214.0 | 412.0 | 105.6 | 413.4 | 399.5 | |
| storj | global | 221.9 | 299.9 | 784.1 | 126.7 | 507.9 | 354.7 | 156.3 | 276.3 | 745.3 | 68.7 | 894.2 | 298.8 |
| us_select | 97.2 | 342.9 | 750.2 | 131.0 | 239.8 | 401.7 | 698.2 | 62.5 | 705.5 | 72.2 | 660.3 | 363.5 | |
| wasabi | ap | 80.3 | 904.7 | 77.4 | 121.7 | 583.1 | 155.4 | 98.5 | 675.3 | 89.2 | 529.8 | 46.5 | 741.3 |
| eu | 451.5 | 109.6 | 894.5 | 134.2 | 550.1 | 363.4 | 262.6 | 288.8 | 543.4 | 47.6 | 930.7 | 284.8 | |
| us_east | 137.1 | 439.9 | 624.2 | 166.6 | 358.6 | 489.8 | 320.8 | 114.9 | 772.7 | 47.0 | 968.2 | 321.3 | |
| us_west | 120.2 | 651.4 | 372.5 | 225.9 | 333.8 | 447.5 | 211.3 | 363.3 | 357.4 | 51.4 | 878.7 | 266.6 |
5GB
| Node Location | Values | ||||||||||||
| London | Los Angeles | New York | Sydney | ||||||||||
| S3 Provider | Bucket Region | GET Throughput MiB/s | GET TTFB ms | PUT Throughput MiB/s | GET Throughput MiB/s | GET TTFB ms | PUT Throughput MiB/s | GET Throughput MiB/s | GET TTFB ms | PUT Throughput MiB/s | GET Throughput MiB/s | GET TTFB ms | PUT Throughput MiB/s |
| aws | ap | 23.9 | 549.1 | 120.5 | 52.0 | 334.3 | 170.3 | 35.3 | 427.7 | 153.1 | 347.9 | 54.4 | 778.4 |
| eu | 364.8 | 61.0 | 839.6 | 67.2 | 300.9 | 209.9 | 88.4 | 187.5 | 327.3 | 19.8 | 508.3 | 131.5 | |
| us_east | 53.4 | 220.0 | 339.4 | 119.4 | 181.4 | 286.5 | 194.7 | 105.6 | 534.5 | 23.2 | 451.8 | 167.4 | |
| us_west | 38.1 | 387.7 | 202.4 | 265.2 | 72.3 | 343.1 | 86.5 | 226.7 | 216.6 | 22.0 | 332.2 | 195.4 | |
| backblaze | eu | 215.8 | 98.3 | 262.3 | 61.5 | 486.7 | 173.1 | 120.2 | 336.8 | 179.6 | 35.8 | 704.9 | 98.0 |
| us_east | 98.8 | 242.5 | 283.8 | 111.1 | 196.0 | 298.7 | 228.8 | 82.0 | 294.8 | 41.7 | 567.7 | 132.5 | |
| us_west | 67.8 | 437.5 | 152.6 | 246.3 | 88.1 | 264.3 | 121.1 | 216.7 | 243.0 | 48.9 | 428.9 | 174.3 | |
| storj | global | 131.7 | 362.4 | 429.1 | 48.8 | 546.7 | 199.6 | 70.5 | 295.0 | 437.1 | 32.5 | 323.0 | 136.2 |
| us_select | 65.6 | 513.9 | 412.6 | 85.0 | 332.0 | 473.3 | 405.9 | 65.6 | 768.4 | 29.4 | 833.0 | 226.3 | |
| wasabi | ap | 33.3 | 630.0 | 28.6 | 61.7 | 671.0 | 62.6 | 52.5 | 774.9 | 43.1 | 225.0 | 56.1 | 279.2 |
| eu | 166.1 | 88.9 | 687.3 | 70.6 | 643.1 | 234.2 | 103.4 | 303.8 | 391.1 | 24.0 | 545.6 | 134.0 | |
| us_east | 90.2 | 410.6 | 280.3 | 104.4 | 377.5 | 315.1 | 125.1 | 133.2 | 552.9 | 24.0 | 915.7 | 145.5 | |
| us_west | 67.8 | 753.4 | 165.9 | 106.6 | 319.6 | 327.3 | 102.7 | 370.8 | 274.8 | 30.6 | 580.6 | 151.1 |
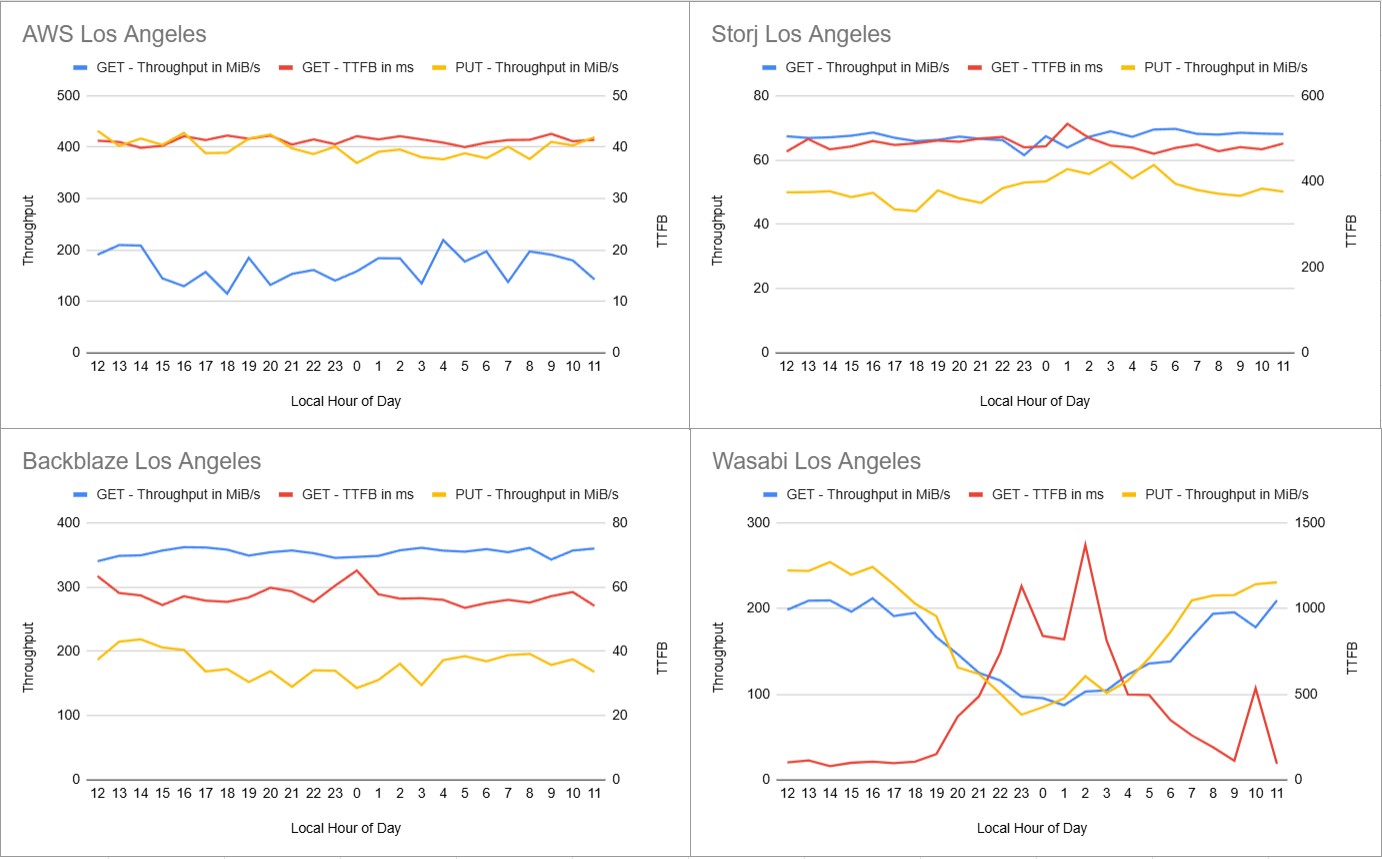
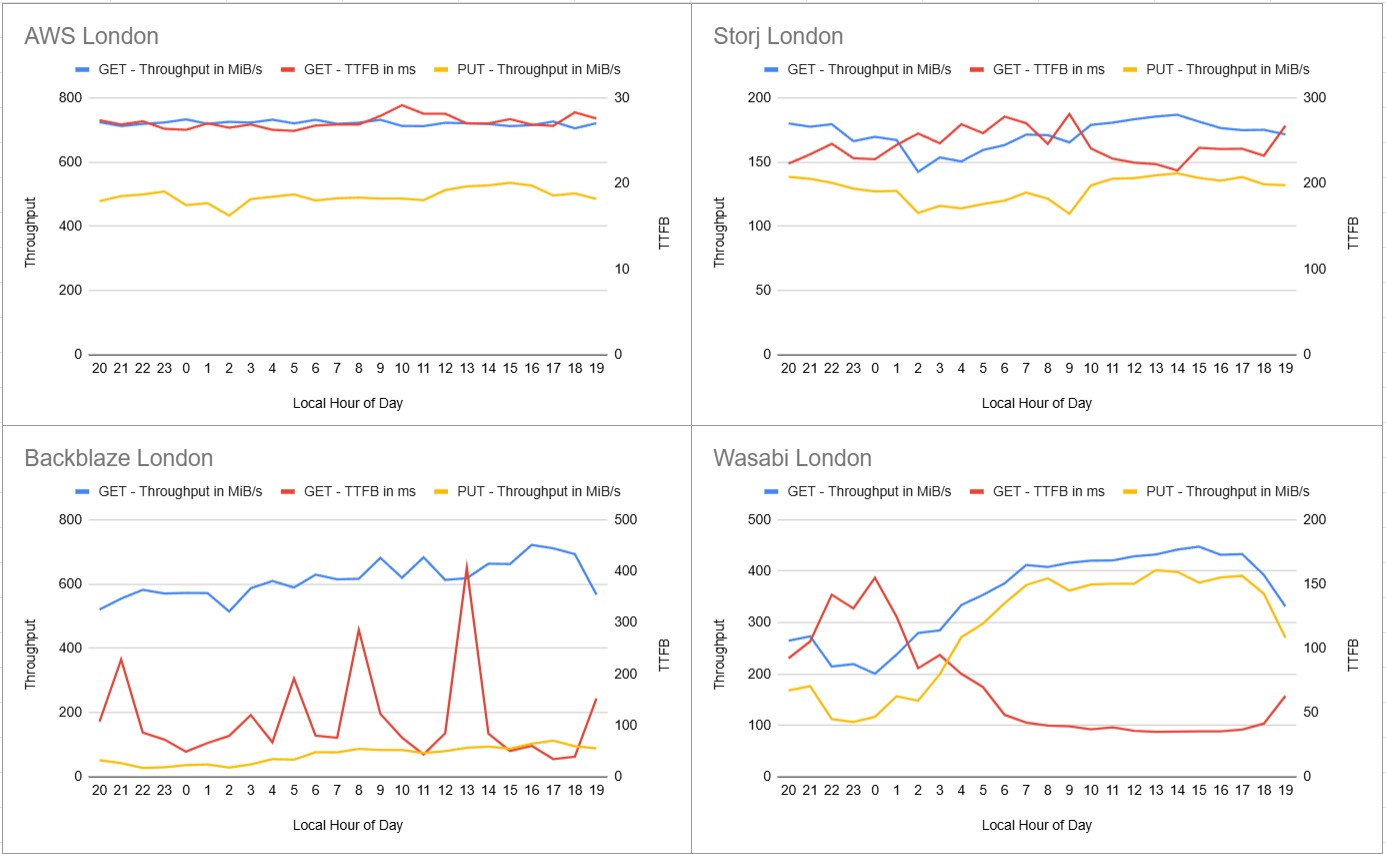
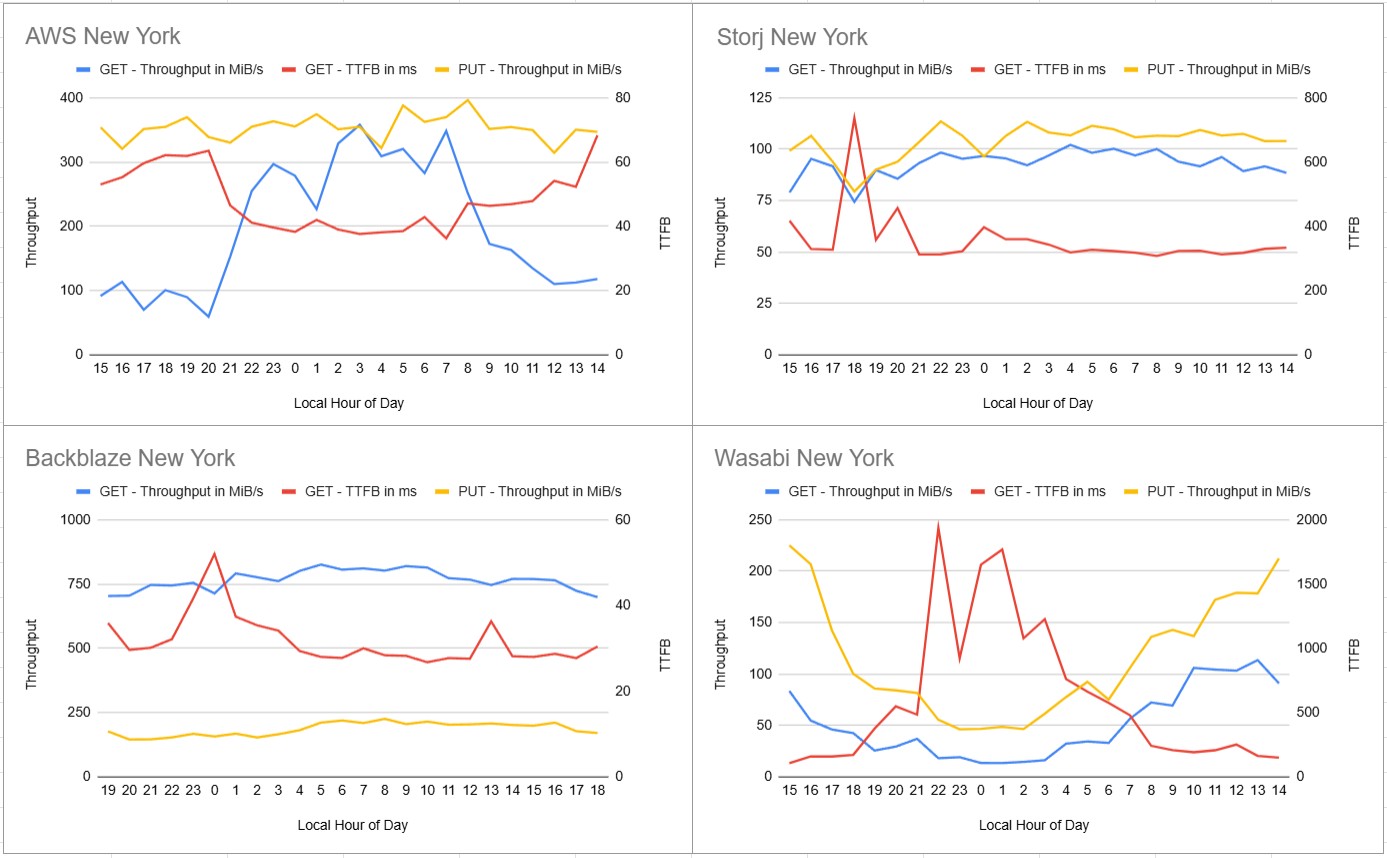
These tests also sought to investigate the question of whether certain times of day would see performance decreases in each region. It stands to reason that many storage customers perform their backup operations in the middle of the night, and therefore, throughput might decrease within a region during the time that most customers in that region are performing backups. Less than one full day of testing was deemed to be less than sufficient to make claims about the effect of Time of Day on the performance of object storage providers; therefore, one full week of tests with a lower bandwidth requirement were conducted. The following pages present charts that show the performance of buckets from each provider when accessed by nodes within the same region.
Time Series
Los Angeles
London
New York
Sydney
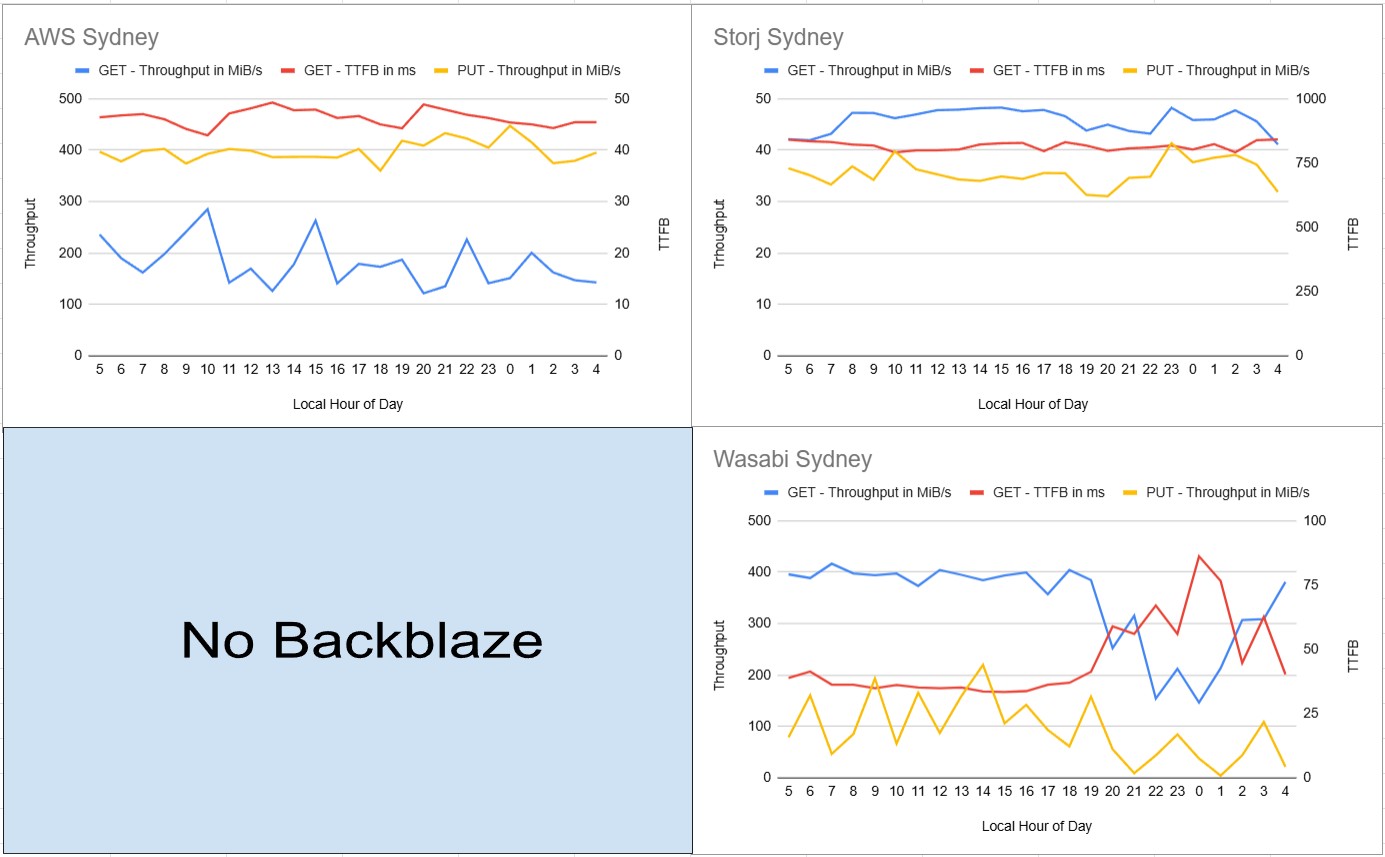
Some times of day in these charts have sharp peaks, such as 1300 in Backblaze London or 1800 in Storj New York. These were primarily caused by instances where one test out of seven for that time of day had such extreme results that it skewed the data based on a possible outlier. A few outliers were removed from the data because upon further inspection, the results of Warp’s benchmark were nonsensical, but the frequency of outliers in Backblaze data made it seem like a real effect that couldn’t be ignored. Again, the complete data can be viewed at the following link:
Conclusions and Analysis
Performance Variability Throughout the Day
Analysis of performance data across different time periods reveals that provider performance is not constant throughout the day, with some services showing significant temporal variations that could impact operational planning.
Key Findings:
- Wasabi demonstrates the most pronounced time-based performance fluctuations, with notable degradation during certain hours, likely correlating with increased backup and batch processing workloads from other customers
- Backblaze shows performance instability with extreme outliers that can dramatically skew average performance for specific time periods, making it less predictable for consistent workloads
- AWS demonstrates relatively stable performance throughout the day with minimal time-based variations
- Storj maintains consistent performance across different time periods with less volatility than other providers
Operational Implications:
While these patterns suggest potential optimization opportunities, establishing reliable performance windows for production workloads would require more extensive data collection over multiple weeks to account for day-of-week variations and seasonal patterns.
Global Performance Analysis for Distributed Teams
For organizations with globally distributed teams accessing shared storage, traditional cloud providers suffer from severe cross-regional performance penalties that can render services nearly unusable for remote team members.
Cross-Regional Performance Penalties
When teams access storage buckets located in distant regions, performance degradation is dramatic:
Example – Sydney team accessing EU-based storage (200MB files):
- AWS EU bucket from Sydney: 25.3 MiB/s GET throughput, 513.6 ms latency
- Storj Global from Sydney: 49.3 MiB/s GET throughput, 881.0 ms latency
This represents a 95% improvement in throughput for the remote team member, though Storj Global performs in the middle tier overall for Sydney access rather than leading the field.
File Size Performance Characteristics
Testing across different file sizes reveals distinct architectural behaviors that create specific competitive advantages for different workload types.
Large File Upload Optimization
Storj US Select demonstrates unique performance scaling behavior for upload operations. When accessing US Select from New York, PUT throughput actually improves with larger file sizes:
- 200MB files: 689.1 MiB/s PUT throughput
- 5GB files: 768.4 MiB/s PUT throughput (+11.5% improvement)
This contrasts sharply with traditional providers, where performance typically degrades with larger files:
- AWS US East: -20.5% throughput decrease from 200MB to 5GB
- Backblaze US East: -33.7% throughput decrease
- Wasabi US East: -23.4% throughput decrease
Provider-Specific Operational Considerations
Multi-Regional Deployment Complexity
Backblaze presents unique operational challenges for organizations requiring multi-regional storage deployments. Unlike other providers, Backblaze requires separate accounts for each region where buckets are established, significantly complicating administrative overhead and access management for globally distributed organizations.
Performance Predictability
Provider reliability ranking for consistent performance:
- AWS: Most predictable, though with severe cross-regional penalties
- Storj: Consistent baseline with minimal time-based variation
- Wasabi: High peak performance but with time-based fluctuations
- Backblaze: Strong average performance but prone to extreme outliers
Summary of Key Findings
This comprehensive benchmarking study of object storage providers reveals significant performance variations based on geographic location, file size, access patterns, and temporal factors. The testing methodology evaluated AWS S3, Backblaze B2, Wasabi Hot Storage, and Storj across multiple global regions using standardized workloads.
Geographic Performance Dependencies
Performance characteristics vary dramatically based on the relationship between storage bucket location and access point:
Regional Optimization Benefits: All providers demonstrate superior performance when accessed from geographically proximate locations. Traditional cloud providers show their strongest performance metrics when users access regionally-local buckets.
Cross-Regional Performance Penalties: Significant performance degradation occurs when accessing storage across continental boundaries. Download throughput can decrease by 80-95% when teams access distant regional buckets, with correspondingly higher latency.
Global vs Regional Architecture Trade-offs: Providers with global distribution models offer more consistent cross-regional performance, while regional providers excel in local access scenarios but suffer severe penalties for distant access.
File Size Performance Characteristics
Testing across 200MB, 1GB, and 5GB file sizes revealed distinct architectural behaviors:
Upload Performance Scaling: Some storage architectures demonstrate improved throughput efficiency with larger file sizes, while others show degraded performance. This creates specific advantages for different workload types, particularly for large file operations such as video processing, database backups, and scientific datasets.
Download Performance Consistency: GET operations generally show more stable performance across file sizes compared to PUT operations, though specific provider implementations vary significantly.
Temporal Performance Variations
Performance consistency throughout the day varies considerably among providers:
Time-Based Fluctuations: Some providers show pronounced performance variations during peak usage periods, likely correlating with increased backup and batch processing workloads from customer bases.
Predictability Factors: Providers range from highly consistent performance profiles to those with significant outliers that can impact operational planning and SLA compliance.
Operational Considerations
Administrative Complexity: Providers differ significantly in their multi-regional deployment requirements, with some requiring separate account management for each geographic region.
Performance Predictability: Organizations must balance peak performance capabilities against consistency requirements, particularly for globally distributed teams.
Implementation Guidance
The optimal storage solution depends on specific organizational requirements:
For Regionally Concentrated Operations: Traditional cloud providers offer excellent performance when teams and data remain within the same geographic region.
For Globally Distributed Teams: Organizations with international operations should prioritize solutions that maintain acceptable performance across regions rather than optimizing for peak local performance.
For Large File Workloads: Specific provider architectures demonstrate advantages for upload-intensive operations, particularly in certain geographic configurations.
For Predictable Operations: Organizations requiring consistent performance should evaluate time-based variations and select providers with stable performance profiles aligned to their operational requirements.
The benchmarking data demonstrates that no single provider excels across all metrics and use cases. Success requires matching specific architectural strengths to organizational workflows, geographic distribution, and performance requirements.
Integrated Digital Solutions (IDS) specializes in delivering cutting-edge technology solutions tailored to meet diverse business needs. Their expertise spans video streaming, cloud solutions, software engineering, data analytics, and AI & machine learning. IDS focuses on innovation, offering services like content management, cloud migration, custom software development, and advanced analytics to empower businesses. With a commitment to operational agility, security, and user-centric design, IDS positions itself as a trusted partner for digital transformation and long-term success.